



XIRR, or Extended Internal Rate of Return, calculates the annualized return on an investment when you invest or withdraw money on different dates. It considers both the amount of each cash flow and the date it occurred.
A SIP is a simple example. You invest a fixed amount at regular intervals, so each installment has a different investment date. XIRR can help you work out the return on your overall investment, taking those different dates into account. The same method can be used for mutual funds with multiple purchases, stock portfolios with several buy and sell transactions, and investments where you make additional deposits or withdrawals.
Why do investors need XIRR?
If you make multiple investments at different times, a simple return percentage does not fully account for how long each amount was invested.
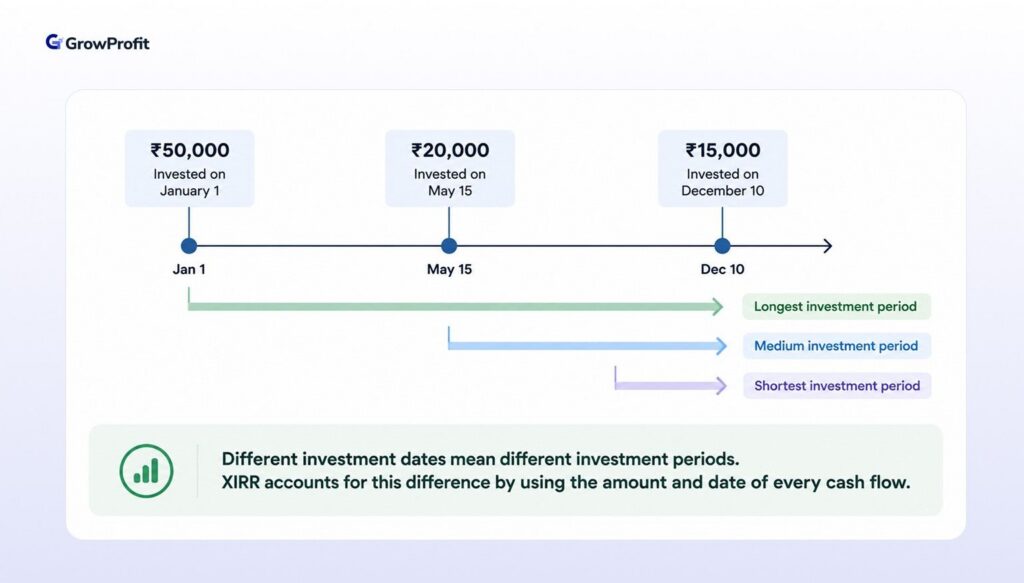
For instance, you invest ₹50,000 in January, another ₹20,000 in May, and ₹15,000 in December. The first ₹50,000 has had much more time to grow than the ₹15,000 invested near the end of the year.
XIRR takes those different investment dates into account. You can use it for:
- SIP investments
- Multiple mutual fund purchases
- Stock purchases made on different dates
- Additional portfolio investments
- Partial withdrawals
- Systematic withdrawal plans
- Dividend receipts
- Investments with irregular cash flows
Microsoft describes Excel’s XIRR function as calculating the internal rate of return for cash flows that are not necessarily periodic.
Why does XIRR matter for Indian investors?
For many Indian investors, SIPs are a regular part of how they invest. But because each SIP installment is invested on a different date, each installment has a different amount of time to grow.
That makes the timing of your investments important when you calculate your overall return.
The scale of SIP investing in India makes this especially relevant. The Association of Mutual Funds in India (AMFI) reported ₹32,297 crore in SIP contributions across 10.02 crore contributing SIP accounts in August 2026. In other words, millions of investors are putting money into mutual funds at regular intervals rather than investing one lump sum at a time.
XIRR gives you a more meaningful picture of how that money has performed over time. It can also help you see how your actual investment performance compares with the return shown for the investment.
The same applies to stocks. If you buy shares at different times, add more money later, and sell some of your holdings, you end up with a series of cash flows on different dates. XIRR can use those dates to calculate the return.
How does XIRR work?
XIRR uses two things:
- Cash flows, or money moving into or out of an investment
- Dates, showing when each cash flow occurred
For example:
| Date | Cash flow | Transaction |
| January 1, 2025 | -₹10,000 | Investment |
| July 1, 2025 | -₹5,000 | Additional investment |
| January 1, 2026 | +₹17,000 | Amount received |
Money invested is generally shown as a negative cash flow because it leaves your account.
Money received from the investment is generally shown as a positive cash flow because it comes back to you.
Using these amounts and dates, XIRR works out the annualized rate that makes the value of all the cash flows equal to zero.
In Excel, the calculation uses the actual dates of the cash flows and a 365-day year for annualization.
The mathematical formula is:
Σ [Pᵢ / (1 + r)^((dᵢ − d₁) / 365)] = 0
Where:
- Pᵢ = each cash flow
- dᵢ = the date of that cash flow
- d₁ = the date of the first cash flow
- r = XIRR
- 365 = number of days used for annualization
You don’t need to calculate XIRR yourself using the mathematical formula. Investment platforms and XIRR calculators can do it for you. In Excel, you can also use the built-in XIRR function by entering your cash flows and their corresponding dates.
XIRR example
Suppose an investor makes three investments:
| Date | Cash flow |
| January 1, 2024 | -₹10,000 |
| July 1, 2024 | -₹5,000 |
| January 1, 2025 | -₹5,000 |
| January 1, 2026 | +₹24,000 |
The total amount invested is:
₹10,000 + ₹5,000 + ₹5,000 = ₹20,000
The final value is ₹24,000.
So, the total profit is:
₹24,000 − ₹20,000 = ₹4,000
The absolute return is:
₹4,000 ÷ ₹20,000 × 100 = 20%
However, the XIRR is approximately 11.78%.
| Measure | Result |
| Total invested | ₹20,000 |
| Final value | ₹24,000 |
| Profit | ₹4,000 |
| Absolute return | 20% |
| XIRR | 11.78% |
Why is XIRR lower than the 20% absolute return?
Because the entire ₹20,000 was not invested for the same length of time.
The first ₹10,000 was invested for two years, the next ₹5,000 for 18 months, and the final ₹5,000 for one year. XIRR accounts for these different investment periods when calculating the annualized return.
In this example, 20% is the total gain relative to the amount invested, while 11.78% is the annualized return after accounting for when the money was invested.

How to calculate XIRR
To calculate XIRR, you need the amount and date of every relevant cash flow.
Depending on the investment, this can include:
- Each investment or purchase
- Additional investments
- Withdrawals
- Dividends or other amounts received
- The final amount received
- The current value of an investment, if you are calculating its return up to today
Enter investments as negative values and amounts received as positive values.
For example:
| Date | Cash flow |
| January 1, 2024 | -₹10,000 |
| July 1, 2024 | -₹5,000 |
| January 1, 2025 | -₹5,000 |
| January 1, 2026 | +₹24,000 |
The dates must correspond to the correct cash-flow amounts. A missing transaction or incorrect date can change the XIRR result.
You can then enter the cash flows and dates into an XIRR calculator or use the XIRR function in Excel.
How to calculate XIRR in Excel
Excel has a built-in XIRR function that calculates the annualized return for cash flows that occur on different dates.
The syntax is:
=XIRR(values, dates, [guess])
For example, suppose your data is entered like this:
| Date | Cash flow |
| 01-Jan-2024 | -10000 |
| 01-Jul-2024 | -5000 |
| 01-Jan-2025 | -5000 |
| 01-Jan-2026 | 24000 |
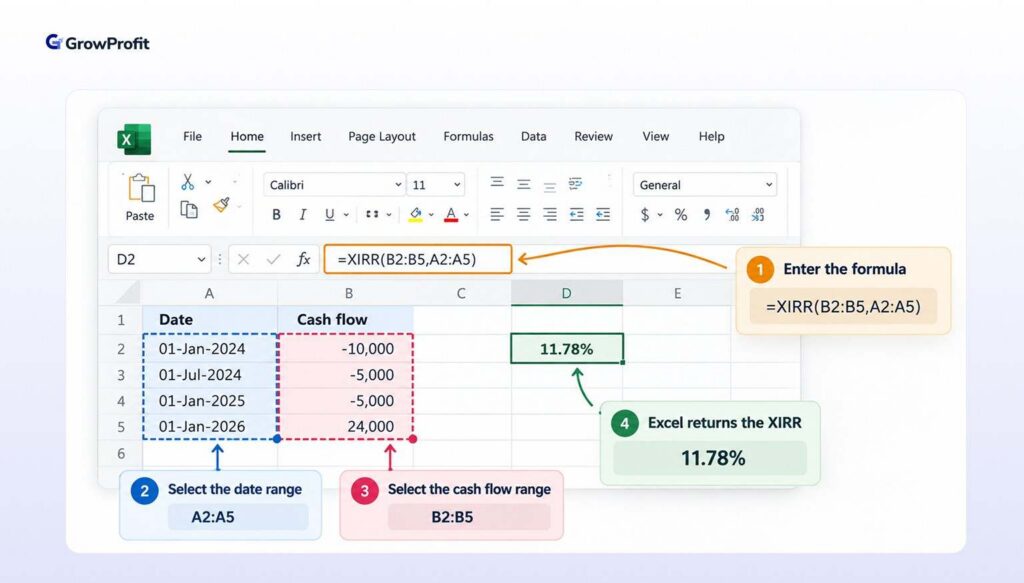
If the dates are in A2:A5 and the cash flows are in B2:B5, enter:
=XIRR(B2:B5,A2:A5)
Excel will return an XIRR of approximately:
11.78%
How to interpret XIRR
XIRR is an annualized return that takes the timing of each cash flow into account.
For example, an XIRR of 11.78% means the investment generated an annualized return of approximately 11.78% based on the amounts and dates of the cash flows.
It does not mean the investment increased by exactly 11.78% every year.
The value of an investment can rise or fall over time depending on the investment, market conditions, and timing of the cash flows.
XIRR vs absolute return vs CAGR
XIRR, absolute return, and CAGR measure returns in different ways.
| Metric | What it measures | Multiple cash flows? | Considers cash-flow timing? |
| Absolute Return | Total gain or loss as a percentage | No | No |
| CAGR | Annualized growth between a beginning and ending value | Generally no | No |
| XIRR | Annualized return based on dated cash flows | Yes | Yes |
XIRR vs absolute return
Absolute return shows the total gain or loss on an investment as a percentage of the amount invested. It does not account for how long individual amounts were invested.
XIRR calculates an annualized return using the timing of each cash flow.
For investments with multiple cash flows, that makes XIRR more useful than absolute return for understanding the annualized return.
In the earlier example:
- Absolute return: 20%
- XIRR: 11.78%
The difference comes from the timing of the investments.
XIRR vs CAGR
CAGR stands for Compound Annual Growth Rate. It expresses the annualized growth rate between a beginning value and an ending value over a defined period.
CAGR is generally used when you have a beginning value, an ending value, and a defined investment period.
XIRR is meant for situations where there are multiple cash flows on different dates.
For example:
- A ₹1 lakh lump-sum investment that grows to ₹1.5 lakh over three years can be evaluated using CAGR.
- A portfolio where you invest ₹10,000 in January, another ₹5,000 in July, and another ₹5,000 the following January can be evaluated using XIRR because each investment has a different date.
Common mistakes when calculating XIRR
Even a small error in your cash-flow data can change the XIRR result. Some common mistakes include:
- Leaving out an investment, withdrawal, dividend, or other relevant cash flow
- Entering the wrong transaction date
- Using the wrong positive or negative sign for a cash flow
- Using an incorrect current or final investment value
- Treating investments made on different dates as though they happened on the same date
- Entering dates that do not correspond to the correct transaction amounts
Use the actual transaction amounts and dates from your investment records.
What are the limitations of XIRR?
XIRR is only as accurate as the information you put into it. If a transaction is missing or a date is wrong, the result will be wrong too.
XIRR measures the annualized return based on your cash flows. It does not tell you whether an investment is suitable for your risk level, explain why the investment gained or lost value, or predict its future performance.
A high or low XIRR by itself should not be treated as a complete assessment of an investment.
FAQs
Is XIRR better than absolute return?
XIRR and absolute return measure different things. Absolute return shows the total gain or loss, while XIRR calculates an annualized return that accounts for the timing of cash flows.
For investments with multiple cash flows, XIRR provides information that absolute return does not.
Is XIRR the same as CAGR?
No. XIRR and CAGR (Compound Annual Growth Rate) both express returns as an annualized rate, but they are used in different situations.
XIRR accounts for multiple cash flows occurring on different dates, while CAGR is generally used when there is a beginning value, an ending value, and a defined investment period.
Can XIRR be used for SIPs?
Yes. XIRR can be used for SIPs because each SIP installment is a separate cash flow with its own investment date.
XIRR considers the amount and timing of each installment when calculating the annualized return.
Can XIRR be negative?
Yes. XIRR can be negative when the value received from an investment is lower, relative to the timing and amounts of the cash flows, than the amount invested.
Does XIRR account for the timing of investments?
Yes. XIRR uses the date of each cash flow when calculating the annualized return.
This is what makes it useful for investments involving multiple deposits, investments, or withdrawals.
What information do I need to calculate XIRR?
You need the amount and date of each relevant cash flow.
This can include investments, withdrawals, dividends, and the final value or amount received from the investment.
Can I calculate XIRR in Excel?
Yes. Excel has a built-in XIRR function.
If your cash flows are in cells B2:B5 and the corresponding dates are in A2:A5, use:
=XIRR(B2:B5,A2:A5)
Excel will calculate the annualized return based on those cash flows and dates.