
If you are new to investing, you may have come across terms like Nifty 50, Price Return Index (PRI), Total Return Index (TRI), and benchmark. They can sound complicated at first. But the basic idea is quite simple.
The Nifty 50 tracks 50 of the largest and most actively traded companies listed in India. You cannot directly buy the Nifty 50 itself. Instead, you can invest in a Nifty 50 index fund or ETF that aims to track the index.
Now, here is where PRI and TRI come in.
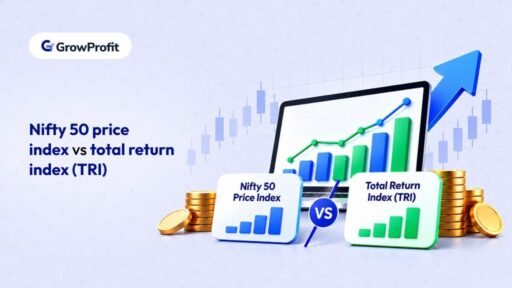
The Nifty 50 Price Return Index (PRI) looks at how the prices of the Nifty 50 stocks change.
The Nifty 50 Total Return Index (TRI) looks at both the change in stock prices and the dividends generated by those stocks, assuming those dividends are reinvested.
That small difference can matter a lot over a long period.
So, let’s break it down.
What exactly is Nifty 50?
Think of the Nifty 50 as a basket. Instead of buying shares of just one company, the basket contains shares of 50 large companies from different sectors.
These can include companies from areas such as banking, technology, energy, automobiles, consumer goods, and telecom.
The index gives different weights to these companies based on the index methodology. The weights can change over time.
When the share prices of the companies in the basket rise, the Nifty can rise.
When they fall, the Nifty can fall.
If you invest in a Nifty 50 index fund, the fund tries to mirror this basket for you.
So you don’t have to pick the individual stocks yourself.
What is the Nifty 50 Price Return Index (PRI)?
The Price Return Index, or PRI, measures the change in the prices of the stocks in the index. It does not include dividends paid by those companies.
Imagine you invest Rs. 10,000 in a hypothetical investment that tracks the Nifty 50.
Suppose the stock prices rise by 10% over the year.
Your Rs. 10,000 becomes Rs. 11,000
That 10% price increase is what the Price Return Index captures.
But something is missing. The companies in the index may also pay dividends. But PRI does not include those dividends in its return.
What is the Nifty 50 Total Return Index (TRI)?
The Total Return Index, or TRI, includes two things:
- The increase or decrease in stock prices
- Dividends paid by the companies, assuming those dividends are reinvested
So, imagine the same Rs. 10,000 investment.
The stock prices increase by 10%.
You also get the equivalent of a 2% dividend return.
For this simple example, the total return would be roughly 12%.
So, instead of looking at only 10% on Rs. 10,000, that becomes Rs. 11,000
TRI considers the effect of:
Price growth + dividends that are reinvested
This is why TRI gives you a more complete picture of the return from the underlying basket.
The actual TRI calculation is more precise than simply adding a price return and dividend yield. The 10% + 2% example is only meant to make the concept easier to understand.
Nifty 50 PRI vs TRI: What is the difference?
Here is the simplest way to look at it:
| Nifty 50 PRI | Nifty 50 TRI | |
| Tracks stock-price changes | Yes | Yes |
| Includes dividends | No | Yes |
| Assumes dividends are reinvested | No | Yes |
| Shows the effect of compounding dividends | No | Yes |
| Useful for comparing mutual-fund performance | Less complete | More appropriate |
So, if PRI asks:
“How much did the stock prices increase?”
TRI asks:
“How much did the investment grow when we also account for dividends?”
Why do reinvested dividends matter?
This is where things get interesting. Let’s go back to the Rs. 10,000 example.
Suppose, purely for illustration, that the investment produces:
10% annual price growth
and
2% annual dividend return
If we ignore dividends, a 10% annual return would turn Rs. 10,000 into about Rs. 25,937 after 10 years.
But if we assume a 12% annual total return and reinvest those dividends, the same Rs. 10,000 would grow to about Rs. 31,058 after 10 years.
| After | 10% price return only | 12% total return |
| 1 year | Rs. 11,000 | Rs. 11,200 |
| 5 years | Rs. 16,105 | Rs. 17,623 |
| 10 years | Rs. 25,937 | Rs. 31,058 |
That is a difference of about Rs. 5,121 on an initial Rs. 10,000.
And remember, this is only an illustration.
The Nifty does not deliver a fixed 10% price return and 2% dividend return every year. Actual returns move up and down. The point is to show what happens when dividends are allowed to compound over time. The longer you stay invested, the more important this difference can become.
Why does reinvesting the dividend make such a difference?
Imagine one of the companies you indirectly own through the index pays a dividend.
Instead of taking that money out, imagine it is reinvested.
Now you have a little more money invested.
That extra money can then generate returns.
Those returns can generate more returns.
This is compounding.
It is the same basic idea behind earning returns on your earlier returns.
That is why a 1% or 2% difference may not look very exciting in one year.
But over 10, 20, or 30 years, it can become much more impactful.
What is a benchmark?
A benchmark is simply a yardstick. It gives you something to compare your investment against.
For example, suppose you invest in a Flexi Cap Fund.
After a year, your fund has returned:
12%
You want to know:
“Is 12% good?”
Looking at the return alone doesn’t tell you much.
You need something to compare it with.
Suppose the fund’s benchmark returned 13% during the same period.
Your fund made 12%, while its benchmark made 13%.
So, the fund did not quite match its benchmark.
That’s the job of a benchmark. It gives you context for your investment’s return.
It’s similar to checking your marks in an exam. A score of 80% may sound good, but knowing the class average gives you more context.
Why does the price-index benchmark flatter you?
This is an important point.
Suppose your Nifty 50 fund returns 11.5%.
Now imagine:
Nifty 50 PRI = 10%
Nifty 50 TRI = 12%
If you compare your fund with PRI, it looks like this:
Your fund: 11.5%
PRI: 10%
You might think:
“Great! My fund beat the Nifty by 1.5 percentage points.”
But look at the TRI comparison:
Your fund: 11.5%
TRI: 12%
Now the picture is different.
Your fund actually returned 0.5 percentage points less than the total-return benchmark.
This is why comparing an investment that benefits from dividends with a benchmark that ignores dividends can make the investment look better than it really did relative to its market yardstick.
That is what we mean when we say a price-index benchmark can flatter your performance.
It is not necessarily telling you that your investment is bad.
It is telling you that you may be using the wrong yardstick for the comparison.
What does SEBI say about TRI?
This is not just a theoretical difference.
SEBI addressed this specifically in its January 4, 2018 circular, “Benchmarking of Scheme’s performance to Total Return Index.”
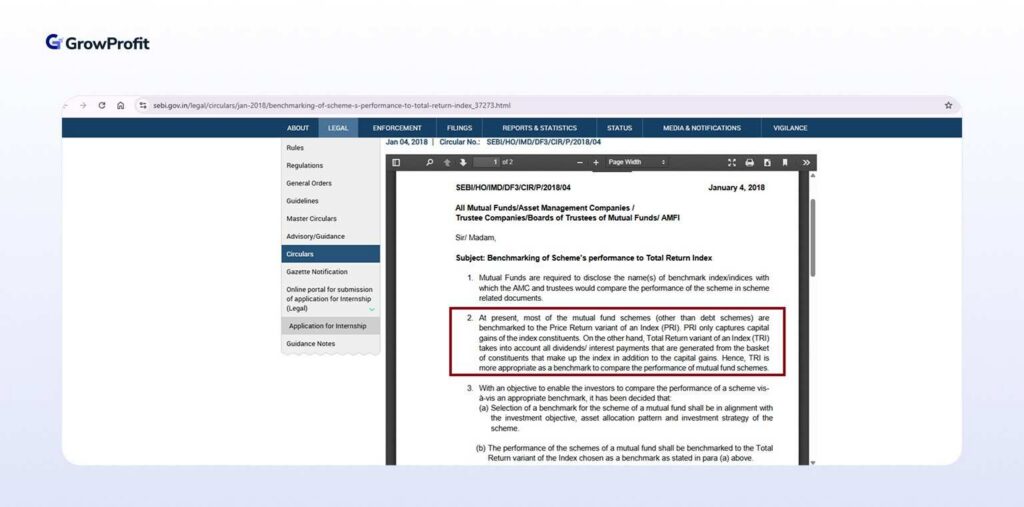
SEBI noted that most mutual-fund schemes were then benchmarked against the Price Return Index.
It explained that PRI captures capital gains, while TRI also takes into account dividends and interest generated by the securities in the index.
SEBI therefore stated that TRI is more appropriate for comparing mutual-fund scheme performance.
The circular also said that the benchmark selected for a mutual-fund scheme should match the scheme’s investment objective, asset allocation, and investment strategy. It then required scheme performance to be benchmarked against the Total Return version of the chosen index.
SEBI’s current Master Circular for Mutual Funds dated March 20, 2026 continues this requirement.
It states that:
- The benchmark should align with the scheme’s investment objective, asset allocation, and investment strategy.
- Scheme performance should be benchmarked against the Total Return variant of the chosen index.
- Where TRI data is not available for the entire historical period, a composite CAGR using PRI for the earlier period and TRI once available can be used.
So, if you see a mutual fund showing Nifty 50 TRI as its benchmark, this is why.
Does this mean your Nifty 50 fund will earn the same return as Nifty 50 TRI?
No.
This is another important distinction.
Suppose:
Nifty 50 TRI: 12%
Your Nifty 50 index fund: 11.7%
The fund is not expected to magically earn exactly 12%.
There can be differences because of things such as fund expenses, transaction costs, cash holdings, taxes where applicable, and tracking differences.
An index fund’s job is generally to track its index as closely as possible.
So when you evaluate it, you want to know how closely it has tracked its appropriate TRI benchmark.
PRI vs TRI: Which one should you look at?
It depends on what you are trying to understand. If you simply want to know how the prices of the Nifty 50 stocks moved, PRI is useful.
If you want to understand the return of the index while accounting for dividends, TRI is more useful.
And if you are comparing the performance of a mutual fund with its benchmark, TRI offers a more reliable comparison.
What should an investor remember?
You don’t need to memorize all the technical details.
Just remember these three things:
Nifty 50 = A basket that tracks 50 large Indian companies.
PRI = Tracks price changes. Dividends are not included.
TRI = Tracks price changes + dividends, assuming they are reinvested.
And when you compare a mutual fund with its benchmark, you want the comparison to be fair.
That is why SEBI moved mutual-fund performance benchmarking toward the Total Return Index.
The simplest way to remember it
Think of PRI as asking: “How much did the stocks’ prices go up?”
Think of TRI as asking: “How much did I make from the stocks going up and the dividends they generated?”
And think of the benchmark as: “What should I compare my fund’s performance against?”
For a Nifty 50 mutual fund, Nifty 50 TRI is usually the better yardstick than Nifty 50 PRI.
FAQs
What is TRI in mutual funds?
TRI stands for Total Return Index. It measures both the change in an index’s stock prices and the dividends or interest generated by its constituents, assuming those payouts are reinvested. This makes TRI a more complete way to compare a mutual fund’s performance with its benchmark.
Where can I find the TRI of my mutual funds?
You can usually find the benchmark name and its TRI performance in your mutual fund’s factsheet, scheme information document, or performance section on the fund house’s website. You can also check the relevant index provider’s website, such as NSE Indices, for information on Nifty TRI benchmarks.
What is meant by NIFTY 500 TRI?
NIFTY 500 TRI is the Total Return version of the NIFTY 500 index. The NIFTY 500 tracks 500 large, mid, and small-cap companies listed in India. The TRI version measures their price movement plus dividends, assuming the dividends are reinvested. So, if you see NIFTY 500 TRI listed as a mutual fund’s benchmark, it means the fund’s performance is being compared with the total return of the NIFTY 500.
Which is better, the Nifty 50 or Sensex?
The Nifty 50 tracks 50 companies, while the Sensex tracks 30 companies. Both are widely followed Indian stock-market indexes and include large companies across major sectors. If you are comparing investments, don’t choose between them just because one index had a higher return over a particular period. Look at the fund’s investment objective, benchmark, costs, diversification, and long-term performance.