



The Time-Weighted Rate of Return (TWRR) is a performance metric that calculates the compound rate of growth in an investment portfolio without the distorting effects of cash inflows and outflows.
The standard TWRR formula geometrically links the returns of distinct sub-periods:
TWRR = [(1 + R1) × (1 + R2) × … × (1 + Rn)] − 1
(Where R is the Holding Period Return for each sub-period between cash flows).
If you invest in an Indian Portfolio Management Service (PMS) or Alternative Investment Fund (AIF), TWRR is the most important metric on your factsheet. Because investors constantly add or withdraw capital, TWRR breaks the timeline into sub-periods to isolate the fund manager’s actual stock-picking skill from the investor’s deposit behavior.
The Core Problem: Why Cash Flows Distort Investment Returns
To understand why institutional finance relies on TWRR, you must look at how absolute, money-weighted returns can hide poor portfolio management.
Imagine you allocate ₹20,00,000 to a portfolio manager. Over the first six months, the manager makes poor stock selections, and the portfolio drops by 25% to ₹15,00,000.
Despite this, you receive a large payout from selling real estate and decide to deposit another ₹50,00,000 into the account. Your new working balance is ₹65,00,000. A week later, the broader Indian market experiences a minor 5% rally, pushing your total portfolio value to ₹68,25,000.
If we look only at absolute numbers:
- Total capital invested: ₹70,00,000 (₹20 Lakh initial + ₹50 Lakh later)
- Final portfolio value: ₹68,25,000
- Total absolute loss: ₹1,75,000 (A seemingly mild loss of 2.5% on the total capital).
Because you added a massive amount of capital late in the year, a tiny 5% market bounce almost entirely wiped out the severe 25% loss the manager generated earlier. If the manager used a standard return calculation, the massive late deposit would completely mask their severe early underperformance.
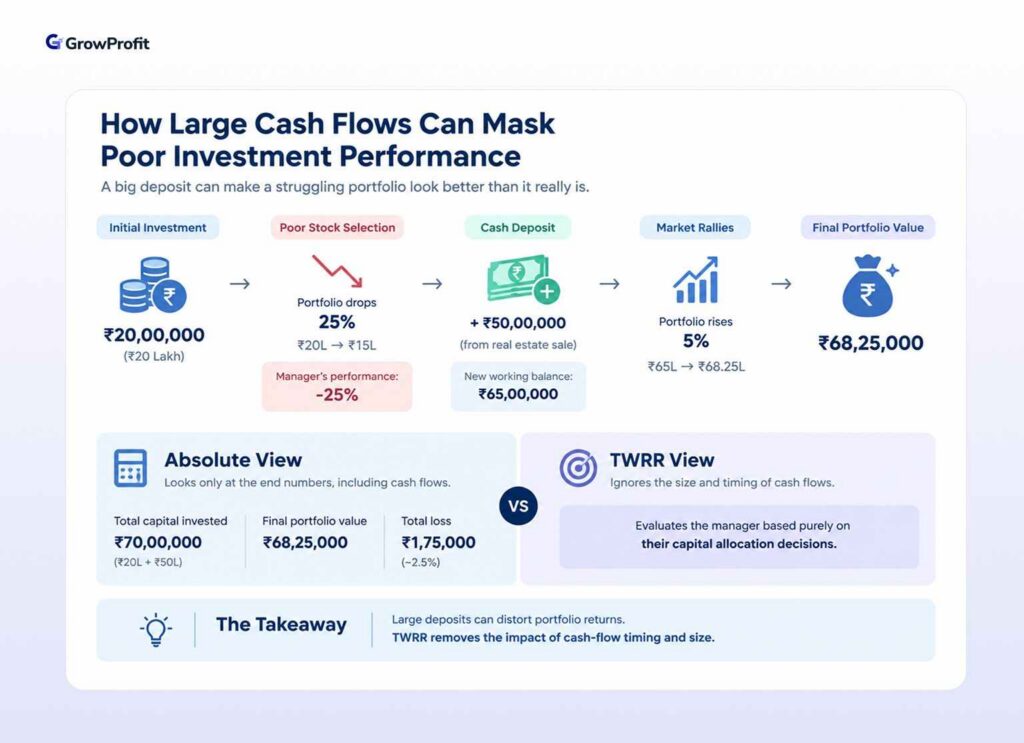
TWRR strips out the size of the cash flows. A ₹10,000 deposit has the same mathematical weight as a ₹10,00,000 deposit. By neutralizing the size and timing of your cash flows, the metric evaluates the manager purely on their capital allocation decisions.
How the TWRR Formula Works
Calculating TWRR requires breaking the overall investment timeline into smaller “sub-periods.” A new sub-period is triggered every single time a cash flow (deposit or withdrawal) occurs.
Step 1: Calculate the Holding Period Return (HPR)
For every individual sub-period, you must calculate the exact return generated before the new money was added or removed.
HPR = (Ending Value − Beginning Value) / Beginning Value
Crucial rule: The “Ending Value” is the precise market valuation of the portfolio immediately before the new deposit or withdrawal is executed.
Step 2: Geometrically Link the Sub-Periods
Once you have the HPR for every sub-period, you cannot simply add them together. Because investment returns compound, you must multiply the growth factors (1 + HPR) of each period, and then subtract 1 from the final product.
TWRR = [(1 + HPR₁) × (1 + HPR₂) × … × (1 + HPRₙ)] − 1
Worked Example: The Single Mid-Year Deposit
Let us run through a realistic Indian market scenario over the 2026 calendar year featuring a single mid-year deposit.
The Timeline and Cash Flows:
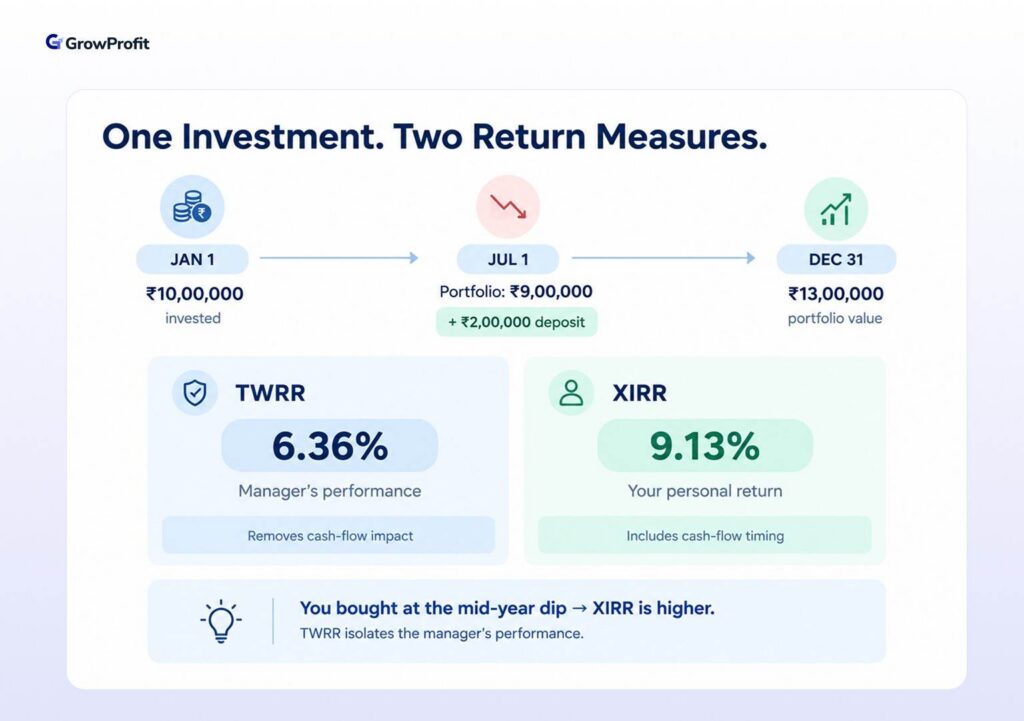
- January 1, 2026: You invest ₹10,00,000.
- July 1, 2026: The market corrects. Your portfolio drops to ₹9,00,000. You view this as a buying opportunity and deposit an additional ₹2,00,000.
- December 31, 2026: The year ends with your portfolio valued at ₹13,00,6nto two distinct sub-periods.
Sub-period 1: Jan 1 to Jul 1
We measure the manager’s performance from the initial investment until the moment before the new deposit.
- Beginning Value: ₹10,00,000
- Ending Value (Before deposit): ₹9,00,000
- HPR 1: (9,00,000 − 10,00,000) / 10,00,000 = -0.10 (or -10.00%)
New Working Balance: The ₹9,00,000 portfolio plus the new ₹2,00,000 deposit gives the manager ₹11,00,000 to manage going forward.
Sub-period 2: Jul 1 to Dec 31
We measure the performance from the new working balance to the end of the year.
- Beginning Value: ₹11,00,000
- Ending Value: ₹13,00,000
- HPR 2: (13,00,000 − 11,00,000) / 11,00,000 = 0.1818 (or 18.18%)
Geometric Linking (The Final Calculation)
Now, apply the chain-link formula to the two sub-periods:
- TWRR = [(1 + HPR₁) × (1 + HPR₂)] − 1
- TWRR = [(1 − 0.10) × (1 + 0.1818)] − 1
- TWRR = [0.90 × 1.1818] − 1
- TWRR = 1.0636 − 1
- TWRR = 0.0636 or 6.36%
The manager generated a pure return of 6.36% on the assets they managed, regardless of the fact that you added capital midway through the year.
The XIRR Difference
If we run these exact 2026 dates and cash flows through an XIRR calculation, your personal money-weighted return is 9.13%.
Why the difference? You experienced a higher personal return (9.13%) because you deployed fresh capital exactly at the mid-year market bottom. However, the portfolio manager cannot claim credit for your excellent timing. The manager’s official TWRR remains 6.36%.
How to calculate TWRR in Excel
Excel does not have a built-in formula for TWRR. You must manually construct the sub-periods and geometrically link them using the PRODUCT function.
To build a TWRR calculator, structure your spreadsheet with the following columns:
| A (Date) | B (Cash Flow) | C (Value Before CF) | D (New Balance After CF) | E (Holding Period Return) |
| 01-Jan-26 | 10,00,000 | 0 | 10,00,000 | 0% |
| 01-Jul-26 | 2,00,000 | 9,00,000 | 11,00,000 | =(C3-D2)/D2 |
| 31-Dec-26 | 0 | 13,00,000 | 13,00,000 | =(C4-D3)/D3 |
Step-by-step logic:
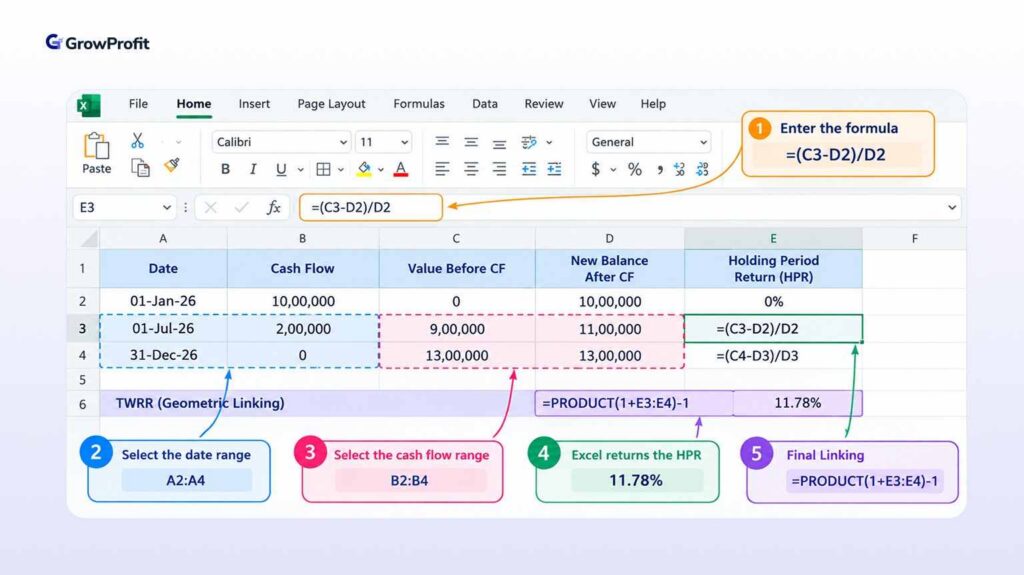
- Column A & B: Enter the date and cash flow (deposits are positive; initial investment is technically a deposit into the portfo
- Column C (Value Before CF): Enter the exact market valuation of your portfolio on that date, before the new cash flow is added or removed.
- Column D (New Balance After CF): Add Column C and Column B. This becomes the starting value for the next period.
- Column E (HPR): The formula in cell E3 is =(C3-D2)/D2. This calculates the percentage change from the previous balance.
- Final Linking: In an empty cell below your table, use the formula =PRODUCT(1+E3:E4)-1. This links the sub-period returns into the final TWRR.
TWRR vs. XIRR vs. CAGR: The Definitive Comparison
Investors frequently confuse the three primary return metrics. Each serves a highly specific analytical purpose.
| Metric | Full Form | How it Handles Cash Flows | Primary Use Case in India |
| TWRR | Time-Weighted Rate of Return | Completely neutralizes the timing and size of cash flows. | Evaluating PMS managers, comparing active funds against benchmarks (like the Nifty 50). |
| XIRR | Extended Internal Rate of Return | Heavily weights the return based on the exact size and date of cash flows. | Evaluating personal investor returns, specifically for systematic investment plans (SIPs). |
| CAGR | Compound Annual Growth Rate | Assumes zero cash flows between the start date and the end date. | Measures point-to-point historical data, fixed deposits, or single lump-sum investments. |
The SIP Dilemma
If you run a ₹10,000 monthly SIP in a mutual fund, TWRR is useless for tracking your personal wealth.
This is because your capital base at the year-end is vastly larger than at the beginning. A 5% market drop in December destroys much more actual wealth than a 5% drop in January, simply because more of your money is exposed to the market. XIRR accurately accounts for this changing capital exposure; TWRR deliberately ignores it.
Use XIRR to measure your personal financial progress. Use TWRR to decide if you should fire your fund manager.
Why SEBI Mandates TWRR for Indian PMS Providers
The Securities and Exchange Board of India (SEBI) strictly mandates that all Portfolio Management Services report their performance using TWRR.
SEBI enforces this rule, alongside the Association of Portfolio Managers in India (APMI), to prevent deceptive marketing and protect high-net-worth investors.
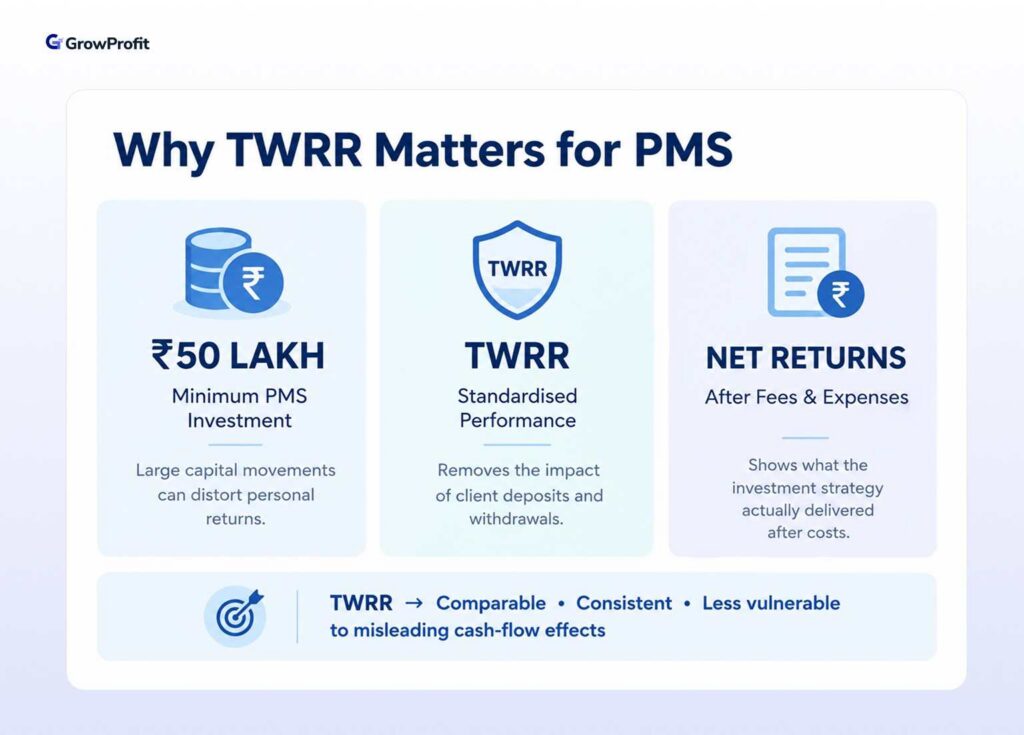
- In India, a PMS requires a minimum investment of ₹50 Lakh. Because these clients frequently move massive tranches of capital for business or real estate needs, the underlying capital base is highly volatile.
- Preventing Cherry-Picked Data. Before this mandate, a deceptive manager could highlight a specific client who deposited ₹1 Crore right before a massive bull run. That client’s personal XIRR might be 40%. The manager could advertise that 40% figure to imply superior stock-picking skill, even if the underlying strategy only generated a 12% return for clients who stayed invested all year.
- SEBI requires that TWRR is reported net of all fees and expenses. Because PMS fee structures often charge a fixed management fee (e.g., 2%) plus a profit share (e.g., 15%), looking at gross returns is misleading.
The reported TWRR you see on an APMI factsheet is the unmanipulated, exact percentage growth a client experiences after the manager extracts compensation.
The GIPS Standard
India’s mandate on TWRR strictly aligns with the Global Investment Performance Standards (GIPS) created by the CFA Institute. By enforcing TWRR, SEBI ensures Indian investors evaluate a domestic PMS using the exact same mathematical framework a global pension fund uses. This prevents wealth managers from using opaque formulas to artificially inflate historical success.
How to Read an Indian PMS Factsheet
- Gross vs. Net TWRR: SEBI requires reporting net of all fees. If a manager claims an 18% gross return but charges a 2% fixed fee and 15% profit share, your actual compounding rate is much lower. Always verify you are reading the “Net TWRR”.
- The Benchmark Comparison: A 15% Net TWRR is meaningless in a vacuum. If your manager’s designated AMFI benchmark (like the Nifty 500) returned 18% over the same period, they destroyed value despite making a profit.
- Drawdowns: Because TWRR neutralizes cash flows, it clearly exposes the manager’s maximum drawdown (the largest peak-to-trough drop). A manager with a slightly lower TWRR but smaller historical drawdowns is often better for capital preservation.
TWRR and Taxation: The Realized Return
TWRR is calculated net of fees, but always pre-tax. Because a PMS operates through your personal demat account, every portfolio rebalancing triggers a direct capital gains tax liability.
- High Churn = High Tax: Frequent trading generates Short-Term Capital Gains (STCG). Even with a market-beating TWRR, the 20% STCG tax drain severely compresses your actual take-home wealth.
- Buy-and-Hold Efficiency: Low portfolio turnover relies on Long-Term Capital Gains (LTCG). A manager with a slightly lower pre-tax TWRR, taxed at the preferential 12.5% LTCG rate, often leaves more wealth in your pocket.
Always check the portfolio turnover ratio. A moderate TWRR compounded long-term usually beats a high TWRR eroded by aggressive short-term trading taxes.
The Limitations of TWRR
- The Burden of Daily Valuations
To calculate TWRR accurately, you must know your exact portfolio value on the specific day a cash flow occurs. Institutions use backend software to generate daily NAVs. But for a retail investor with shares scattered across multiple brokers, pinpointing the precise market value on the random Tuesday they withdrew ₹50,000 is often impossible. Without exact day-of-transaction valuations, the formula breaks.
- Disconnect from Absolute Wealth
TWRR can show a massive positive return even if you lose actual money.
- The Setup: You invest ₹10,000. It doubles to ₹20,000 (a 100% gain).
- The Deposit: You then deposit ₹10,00,000 right before a 10% market crash.
- The Result: Your portfolio shrinks to ₹9,18,000.
You suffered an absolute loss of ₹92,000 (Total invested: ₹10,10,000; Current value: ₹9,18,000). Yet, your TWRR remains a wildly positive 80% [(1 + 1.00) × (1 – 0.10)] – 1.
The manager accurately claims an 80% return based on the capital they had at any given time, but your bank account is still lighter. This proves why TWRR must be viewed strictly as a manager evaluation metric, not a personal wealth tracker.
FAQs
What is a good TWRR for a PMS in India?
A good TWRR for an equity Portfolio Management Service in India typically exceeds the Nifty 50 benchmark return over a three-to-five-year period. Since Indian large-cap indices historically average around 12% to 14% annually, a skilled manager should aim for a TWRR consistently above 15% net of all fees.
Is TWRR always lower than XIRR?
No, TWRR is not inherently lower than XIRR. The difference depends entirely on your cash flow timing. If you deposit money right before a market rally, your XIRR will be higher than the TWRR. Conversely, if you invest before a crash, your XIRR will fall below the manager’s TWRR.
Can my TWRR be negative even if I made an absolute profit?
Yes, this happens if the fund manager performed poorly overall, but you managed to profit due to lucky timing. If you deposit heavily right at the bottom of a crash, your personal wealth grows, but the manager’s official TWRR remains negative because they lost money during earlier sub-periods.
Why do retail Indian mutual funds use XIRR instead of TWRR?
Indian retail investors primarily invest through monthly SIPs, creating multiple cash flows. XIRR is the only accurate way to calculate the true personal wealth generated by these staggered investments. TWRR is used for PMS fact sheets because SEBI mandates measuring the fund manager’s skill independent of the investor’s deposit schedule.
Is TWRR annualized?
By default, TWRR calculates the cumulative return over your entire investment period, not the annualized rate. To compare performance against yearly benchmarks, the cumulative figure must be annualized. In India, SEBI strictly prohibits annualizing returns for periods shorter than one year to prevent misleading marketing.